Project 2 -
Student Failure
Building a model to identify
risk prone students and classrooms
Check code or thesis
Introduction
This thesis was the last of a series of projects aimed at improving the teaching and learning experience at the engineering center of the Federal University of Santa Catarina (UFSC). There weren’t many initiatives working with students’ datasets so there was a lot of room for improvement in terms of management procedures and this series was an attempt to light a spark of change. In this specific dissertation the objective was to build a model to predict which students would fail the subjects they were enrolled in so that the management team could act and efficiently allocate resources to prevent the worst outcomes.
Data
The dataset had student data from 13 courses in the engineering center in the period of 2000-2018. It comprised the socioeconomic profile and their grade history from entry exams until every subject they took to date. There were about 23.000 students over around 25.000 enrollments since students sometimes transferred to other courses within the center or re-enrolled at the same course to renew their GPAs. It summed up to about 1.3 million data points of subjects taken by students.
Exploratory Data Analysis
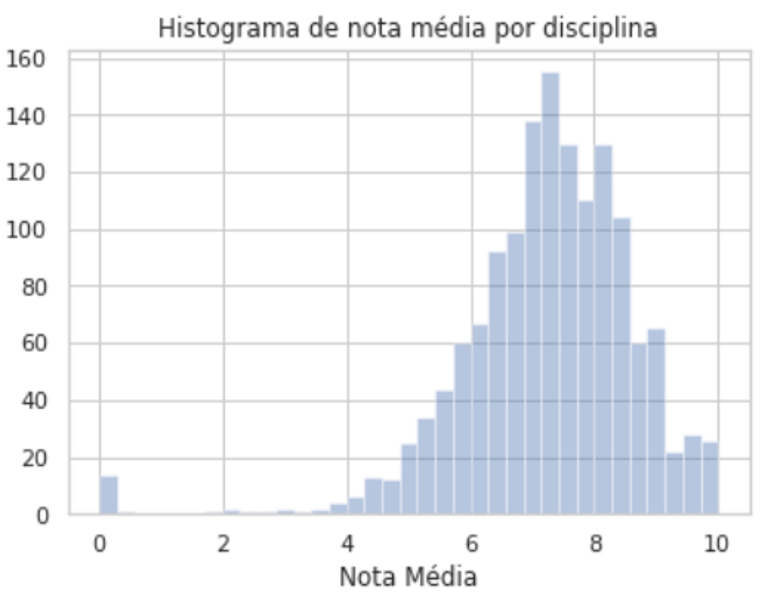
The student grades revealed an overall approval rate of 76% and a 6,21 over 10 overall GPA. The overall GPA of all students had been decreasing over time as we can see in the time-series graph and has dropped about 1.1 points over the time analysed time span.
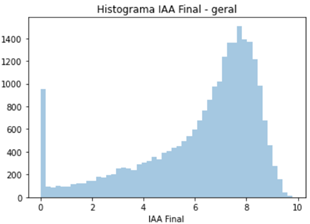
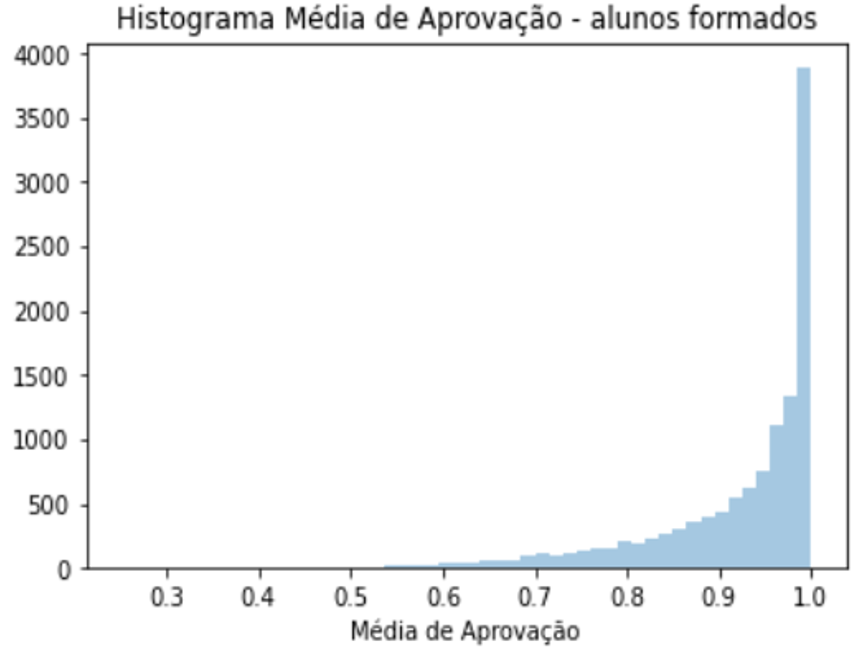
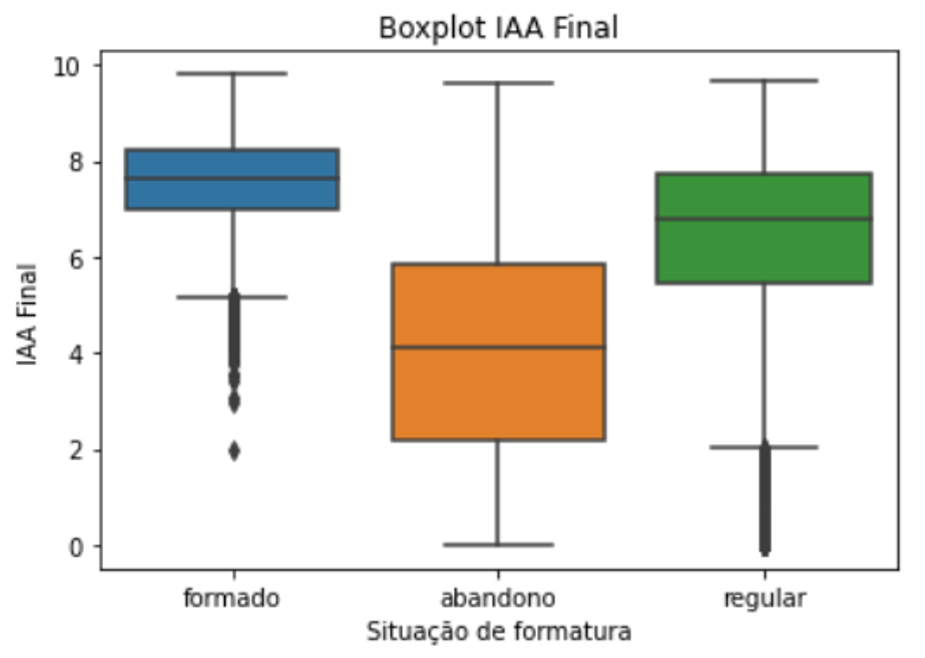
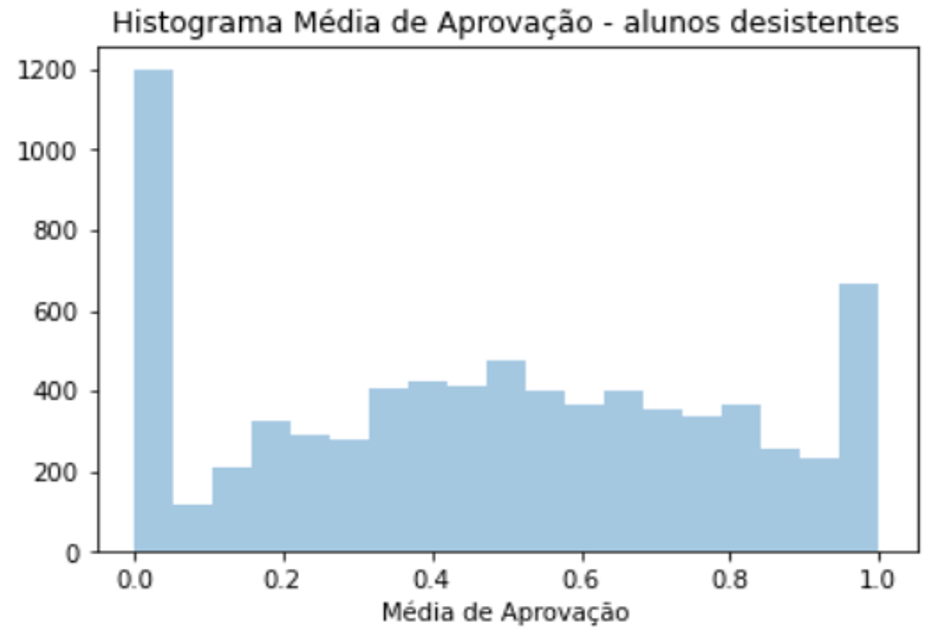
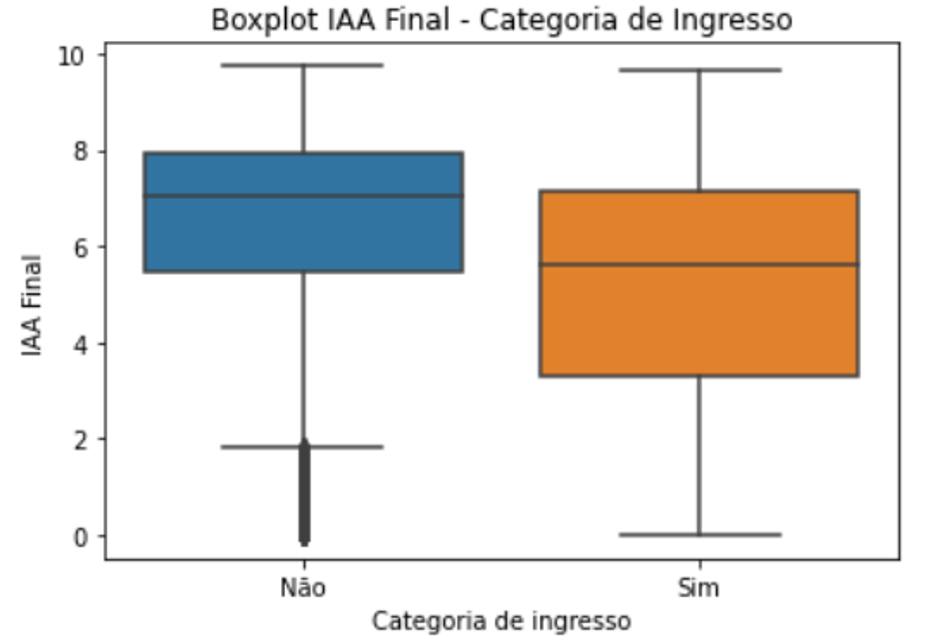
The student GPA histogram shows that performance varied greatly. Out of the students in the dataset 22% were still enrolled, 48% were graduated and 30% left without a diploma. Students that graduated differed greatly from students who didn’t graduate. That can be assessed by their differently distributed GPA histograms or the GPA boxplot of each group.
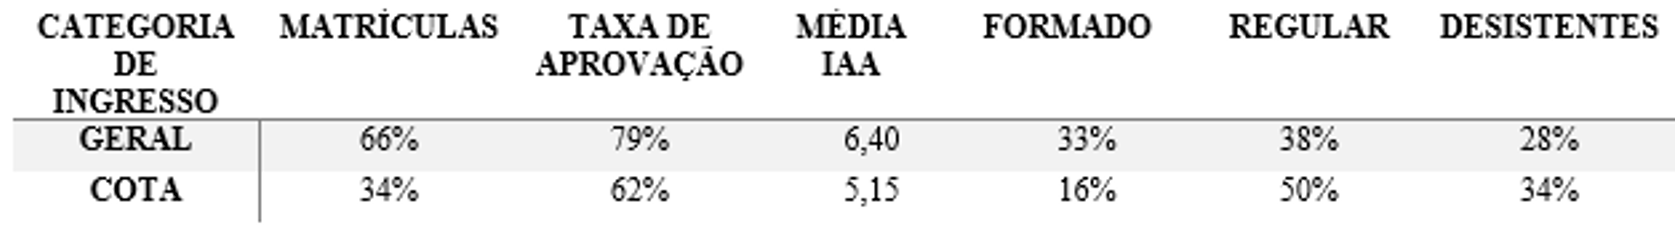
Regarding possible explanations of different performance in terms of approval rate and GPA, a couple of features stood out: quotas, ethnicity, the discipline’s and teacher’s approval rate, how many subjects a student is enrolled in and if it was the first time the student was taking the subject. Student who got into university by quota had lower performance and took longer to get a diploma. The current fraction of abandonment over graduated students jumped from 46% to 68%.
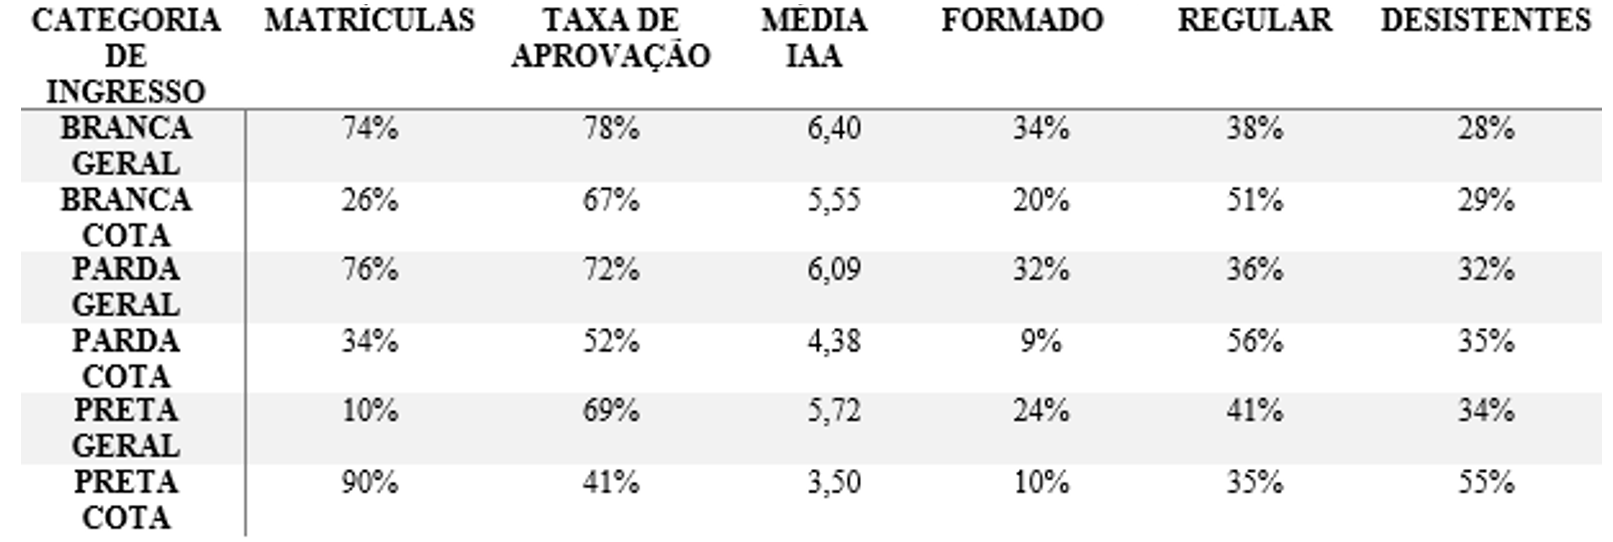
Ethnicity also played a role, but since the quota is also divided by ethnicity, once we isolate the ethnicity concerning quotas, the effect diminishes. It’s also important to notice that 90% of black students got in via quota and that group is by far the one with the highest dropout rate and lowest graduation rate of only 10% to date.
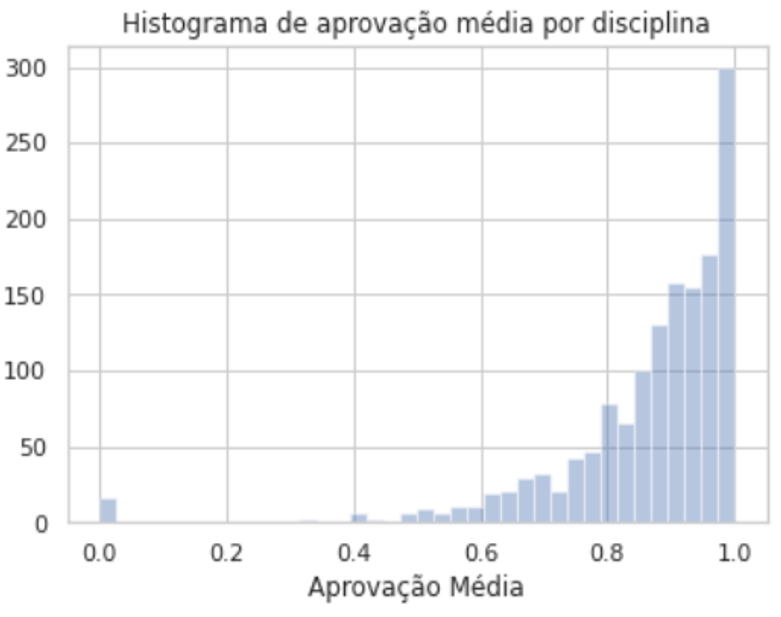
Most subjects had a very high approval rate, but a few of them very low, especially for early ones such as calculus. Teachers had a distribution that resembled the subject distribution except that it was a little less symmetrical and the teacher’s relevance was particularly enhanced when concerning a discipline with low approval rate.


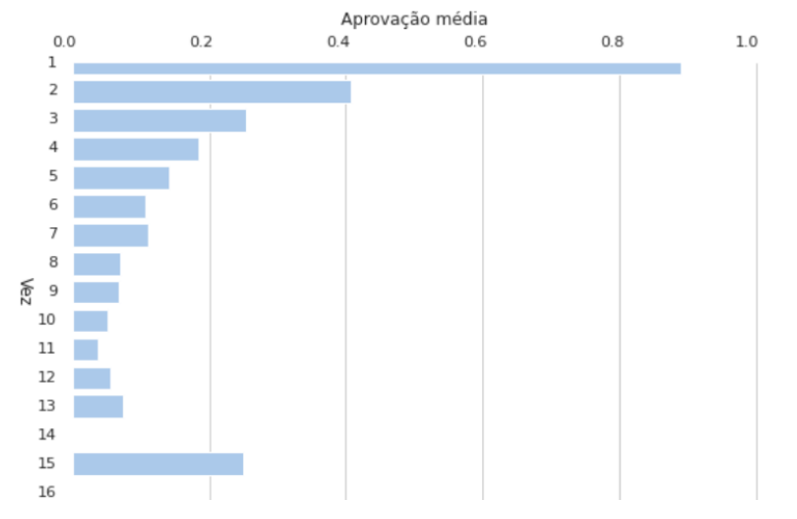
The approval rate of students taking the subject for the first time was significantly higher than the group of students taking a subject for the second time. In fact, that represented a drop of 48%. That only got worse for groups of students who took it 3, 4 or 5 times. That was a consistent effect showing that students who fail a subject often repeat the feat, eventually turning into the dropout student’s profile.

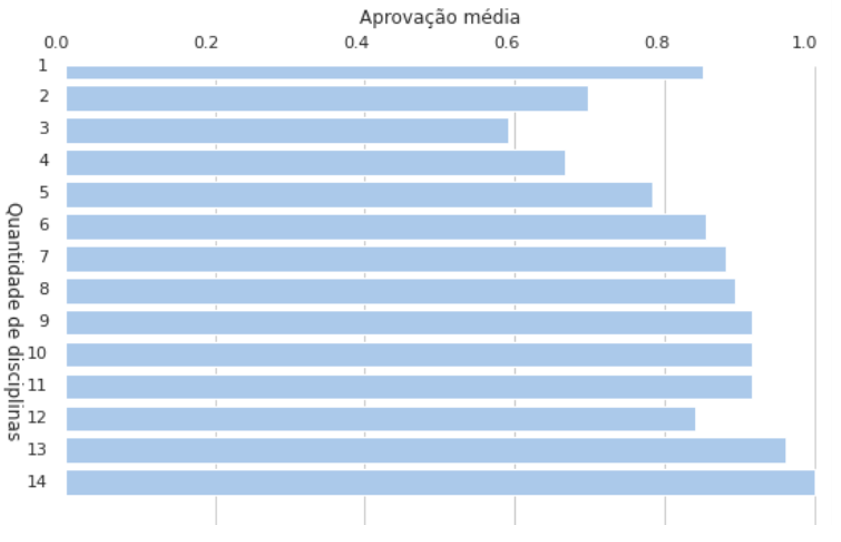
The last meaningful takeaway was that students taking more subjects usually showed a higher approval rate. That is somewhat a countersense but it two explanations might be that they are more commited to the university and specific hard subjects students fail have a lower effect over their approval rate.

Model
As mentioned in the introduction, the model was meant to be a tool for management. Consequently it was elaborated with two use cases in mind: mapping all student failures to identify vulnerable spots such as classrooms and teachers; identifying worst cases where focused actions could be taken. Two models were developed for each case: logistic regression and random forest. However different, all of the models were trained to transform the student subjects enrollment input into a prediction whether he would pass each one.
As for the feature engineering, many different forms of student performance were included such as their approval rates and GPAs one, three, all past semesters and the GPA delta from the previous 2 semesters. The characteristics displayed in the exploratory analysis also became features.
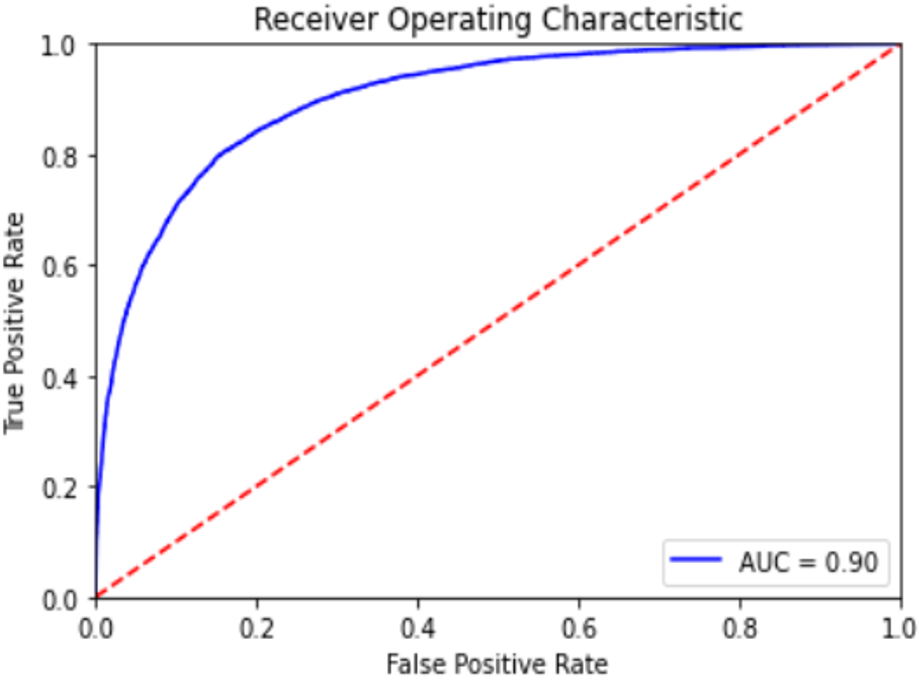
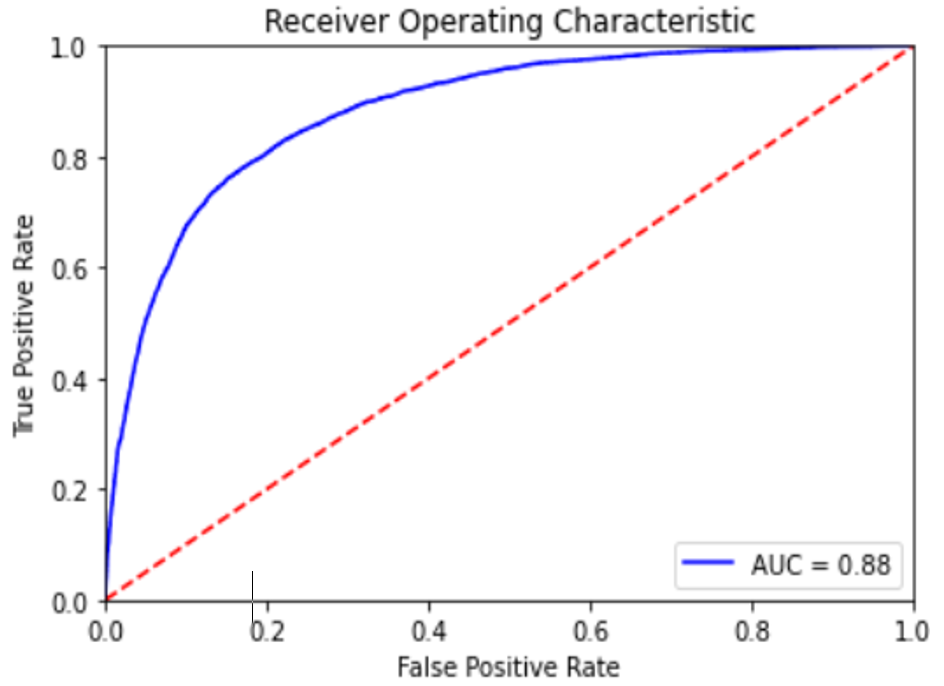
The models were tuned testing different hyperparameters via Random and GridSearch. With the most adequate hyperparameters there’s still a decision in terms of the chosen threshold, at what probability should a data point be classified as a failure and since it depends on every use case, the paper outlined the relevant indicators as well as a general suggestion for each model. The table below explicits the precision, specificity, F1-score and precision at K, all relevant to figure out the best model.

The suggested threshold for each model, the indicators and the resulting confusion matrix are shown below.
Random Forest
| Thres hold | Classif. | Precision | Specificity | F1-Score | P@K |
|---|---|---|---|---|---|
| 0.7 | Failed | 0.86 | 0.37 | 0.52 | 0.87 |
| Passed | 0.84 | 0.98 | 0.91 | ||
| Weighted Average | 0.85 | 0.84 | 0.82 |
| Confusion Matrix | Predicted Negative | Predicted Positive |
|---|---|---|
| True Negative | 19.989 | 355 |
| True Positive | 3.756 | 2.215 |
| Thres hold | Classif. | Precision | Specificity | F1-Score | P@K |
|---|---|---|---|---|---|
| 0.5 | Failed | 0.74 | 0.61 | 0.67 | 0.67 |
| Passed | 0.89 | 0.94 | 0.91 | ||
| Weighted Average | 0.86 | 0.86 | 0.86 |
| Confusion Matrix | Predicted Negative | Predicted Positive |
|---|---|---|
| True Negative | 17.269 | 2.696 |
| True Positive | 1.274 | 4.697 |
Logistic Regression
| Thres hold | Classif. | Precision | Specificity | F1-Score | P@K |
|---|---|---|---|---|---|
| 0.7 | Failed | 0.80 | 0.33 | 0.47 | 0.8 |
| Passed | 0.83 | 0.98 | 0.90 | ||
| Weighted Average | 0.83 | 0.83 | 0.8 |
| Confusion Matrix | Predicted Negative | Predicted Positive |
|---|---|---|
| True Negative | 19.985 | 492 |
| True Positive | 3.999 | 1.972 |
| Thres hold | Classif. | Precision | Specificity | F1-Score | P@K |
|---|---|---|---|---|---|
| 0.5 | Failed | 0.75 | 0.49 | 0.60 | 0.67 |
| Passed | 0.86 | 0.95 | 0.91 | ||
| Weighted Average | 0.84 | 0.85 | 0.84 |
| Confusion Matrix | Predicted Negative | Predicted Positive |
|---|---|---|
| True Negative | 19.375 | 969 |
| True Positive | 3.030 | 2.941 |
Random Forest
- Model 1: 86% sensitivity.
- Model 2: 79% specificity at 36% false positive rate.
Logistic Regression
- Model 1: 80% Sensitivity
- Model 2: 49% specificity at 25% false positive rate.
For the application of identifying worst cases, even though random forest model has slightly better results, the difference of model performance should indicate on using the logistic regression model. Regarding the second use case, the results using the random forest model are a lot better which means it should be the best choice.
ML Approach
The models for prediction have used the training data to learn underlying patters that help explain what is really happening in the natural phenomenon. The feature importance tool displays part of what the model learned and the intensity to each feature’s effect. Using this tool combined with the correlation between features can therefore lead to interesting conclusions and the development of new hypotheses surrounding what makes a student fail. It is however important to take into account that feature importance in each model has different interpretations.

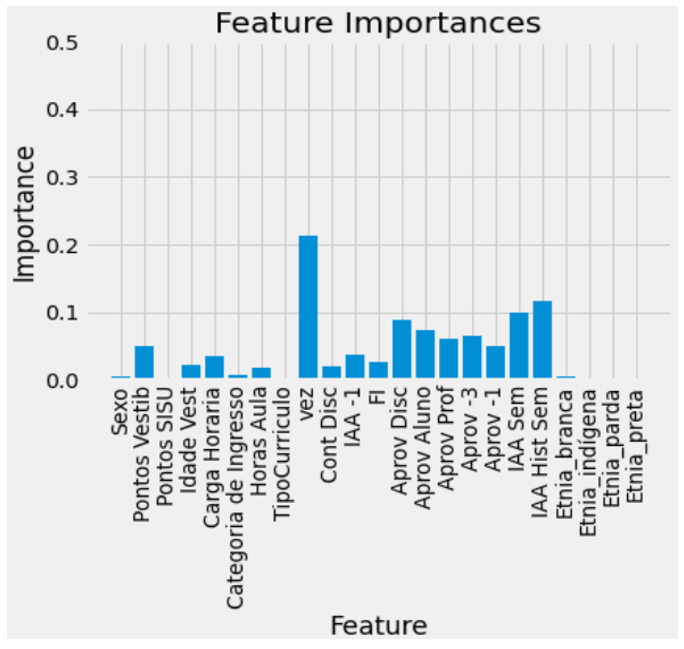
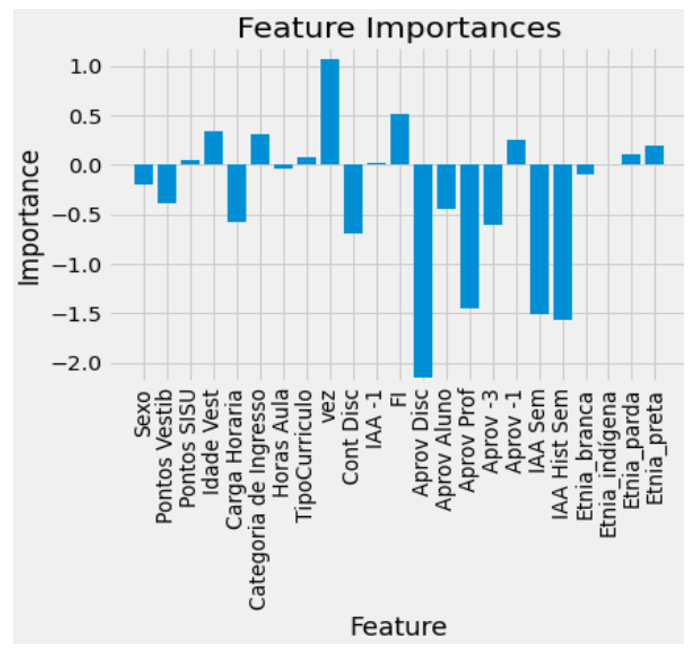
The main features are in both models, the last semester’s GPA, the discipline’s approval rate and the turn taking the subject. An important takeaway is that categories like quota and ethnic group looked important in the exploratory analysis, but don’t seem to interfere much with the predictions. A possible explanation would be the entrance exam dispersion already covers their effect. Also, student GPA seems like a better metric than student’s approval rate. Considering it represents more of a continuum instead of a discretionary value, it might contain more information available for the model.
There were many different hypotheses drawn from these results and it should lay ground for next steps on interpreting student failures as well as a tool for efficiently managing the system.